One of the most frustrating things to happen in any data visualization software is for you to run a query and get back the notification: “This result returns more nodes than you are allowed to have.” It is pretty annoying but understandable for many reasons. When you get into the tens of thousands of nodes, it can get pretty processor-intensive, and there are many other hardware and software limitations. But one of the most important things to remember is that, most of the time, when you are using data visualization software, you can work around the limitations.
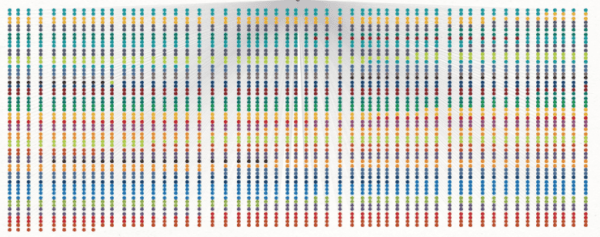
With a few different tricks, we can take a graph that looks like this:
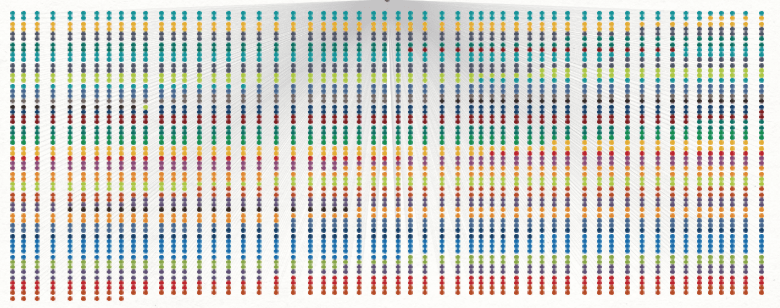
To one that looks like this:
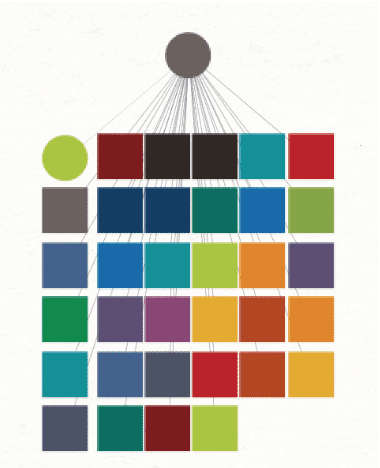
The easiest way to do this is by looking for something similar to the collections tab in Maltego. It is a way to cluster nodes of individual types into one another. Now that we have each individual type of nodes into a collection, we can pull those out into their own graph and review each one however we need. We can do this recursively as well, so if while we are looking at, say, all of the Facebook users we found, we can pull each user out into their own tab and move back over the relevant information.
Some other good ways to not get drowned in results is to limit the amount you are looking at. When querying something simple, for the best result, it may be better to limit the number of results to a more manageable number.
We can also look at how detailed of a starting point we have. If we are starting with a really common name such as John Smith, it may take us a while to filter that down without any other information. We eventually could link a target to the name, but it would be better if we have multiple starting points so that we can quickly push through extra information.
These are just a few ways of looking at data and how we handle it inside of data visualization tools. Sometimes, we have to manually sort through thousands of results, but we have to break those down into manageable chunks to avoid things like rabbit trailing.
The key to any successful investigation is to break each part up into the individual parts and handle them one piece at a time. In-depth online investigations can very quickly get overwhelming, as we saw above. We have to parse through a ton of information, so breaking each piece up into manageable parts, timelining those parts, and organizing them is necessary. Keep track of everything as you go. Do not delete anything, but it is okay to move it around and organize it so you, and more importantly anyone who has to look at it, can see your thought process.